
Ah, the temperatures have fallen (a little), the days have gotten shorter (a lot) and winter is in full swing — the end of the calendar year is near! You don’t need me to remind you that the fundraising season has ramped up. From Giving Tuesday in November through the end of December, and this week in particular, we’re in the thick of it.
Every organization I have the privilege of partnering with is in “focus mode” this week. Achieving end-of-year goals and surpassing the prior year’s giving records are on the forefront of nearly every development professional’s mind. That’s a good thing.
Focusing on what’s right in front of you is important, but the end of the calendar year should also remind us that in just a few short weeks we are about to start anew. Yes, it is busy right now. Yes, we are in the midst of a heavy fundraising season, but in two weeks, when we all return to our offices after a brief holiday respite, it will be a clean 12 month slate for us to work with.
With that in mind, I want to share with you how we use data and metrics to help in our “strategy” and goal setting process here at MarketSmart. True, we’re a for-profit company, and yes we don’t have donors and donations, rather clients and revenue. Yet the metrics we measure and the process we go through to incorporate them into our strategy can and should be applied at your office.
I’ve written extensively in the past about how nonprofits are not like for-profits, and how donors are not customers. Please do not mistake my attempt here to show the parallels between the two (in the context of strategic planning) as an edict that they are the same — they aren’t. But, we can, and should mimic some of the data analysis and strategy components our for-profit peers employ. Let’s take a look at what I mean.
Three metrics to measure at end of year
Data and metrics should be wielded with purpose, not simply because they seem “innovative” or “cool.” To set the stage, please know that the end of a fiscal or calendar year is a good time to take a peek “under the hood.” You can’t go wrong asking questions, poking holes, and analyzing data after 12 months has passed, especially when your organization moves on a 12 month schedule (most that I work with do).
At my firm, MarketSmart, we measure quite a few key performance indicators (KPIs) throughout the year. However we measure only a handful of metrics at year-end to help us create strategic goals for the next 12 months. These metrics help us to know what’s working, what’s not and then define the goals we need to achieve in the coming year to get the results we want to see.
To do the same for your organization, you would measure specific metrics like:
- Average donation amount
- Donation retention rate
- Donor lifetime value
Let’s dive into why you should measure these three metrics. Then let’s discuss how you can use their values to help drive our decision making.
Average donation amount
At your organization, one of your overarching goals for 2019 may be to increase donation revenues by 20% year over year. That’s great, and hopefully you hit it, but is it attainable?
At MarketSmart we strive to grow by a bit more than 20% in 2019 (closer to 50%!), and one of the indicators of how we’ll get there is by looking at our average deal size (the equivalent of your average donation amount). Having been in business close to a decade (if you want to celebrate with us, our ten year anniversary is in June!) we are fortunate to have enough historical data to help us see trends in average deal size.

You can see in the graph above it says, “average gift,” but during my analysis of MarketSmart’s data in Fundraising Report Card®, I knew that really meant “average deal.” As you can see deal sizes ticked down a bit over the past few years (the green dashed line), but picked back up this past year (where you see $6,102 value). This isn’t MarketSmart’s real data, but it’s similar, and for our purposes here it’s a good enough example to work with.
For us, internally, we attributed the slight decline in deal sizes to a few of our tactics and strategic decisions back in 2015. We took this information and developed new tactics that would help increase average deal size in the coming year. By increasing average deal size, we feel more confident in achieving our year over year growth goals.
You can, and should channel this same type of conversation at your development shop.
How have your average donation amounts been trending? Are they going up, down, somewhere in between? What events, appeals, or other tactics did you implement last year, or in the prior years that may have influenced how average donation amounts have ebbed and flowed? Does the evidence support your 2019 overall donation revenue goal?
These are the same kind of questions we at MarketSmart asked ourselves over the last month or so. Approaching data-driven decision making is not overly complex, you simply need to arm yourself with the best possible information to help drive your thought process. In our case, descriptive analytics on average deal size helped guide our goals for 2019, while average donation amount in your case is quality evidence to support or oppose your annual fundraising goal.
Donation retention rate
Similar to donor retention rate, donation retention rate refers to the literal dollars being renewed over a period of time from your donors.
I’ve written extensively in the past about donor and donation retention rates, so if you need a refresher please take a look here. For our purposes, let’s focus on why retention rates, and in particular donation retention rates, is a key metric to measure at the end of the calendar year.
For us at MarketSmart, our revenue retention rate indicates how well we are maintaining relationships with our clients (for you it represents how well you are maintaining relationships with donors). If revenue retention rate slips year over year it’s a sign that the clients we have worked so hard to partner with are investing their budget elsewhere. If revenue retention rates go up then it says to us that we are providing value to our partners and they’re sticking with us.
Revenue retention rate is just a number, but it means so much more. Retention rates in general are storytelling metrics, they measure your organization’s capacity to build and develop meaningful relationships. That’s important!!
Why do we measure this metric at the end of the year? It’s simple. Because clients (and your donors) need all 12 months to potentially renew their contracts (or contributions).
Reviewing retention rates monthly or quarterly is good and well, but you learn quickly that constituents don’t always renew in the same month or quarter year-over-year. Instead, a client (or donor) who purchased something (or donated) in January of 2016 might not renew the next year until February, or March or even September. If you measured month-over-month retention rate in January of 2018 that client (who ultimately did renew later on) wouldn’t have “counted.”
At MarketSmart we measure revenue retention rate in December and then again in January to gauge how well we maintained relationships with our clients during the prior 12 months.
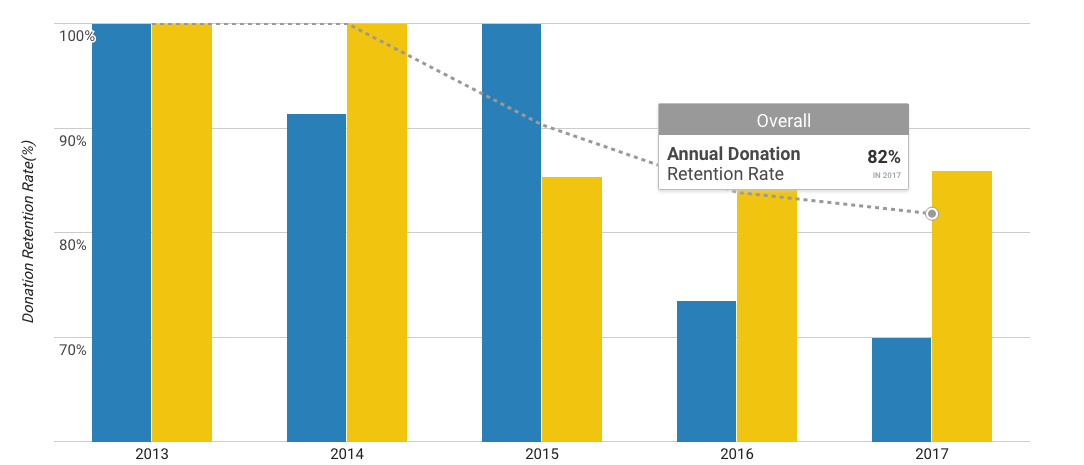
You can see in the chart above how our revenue retention rate has ebbed and flowed at MarketSmart. Again, this isn’t our real data, but it’s similar, and it gives you a fair example of how this report might look for your organization.
As our company has grown revenue retention rates have fallen. Rather than pout, we used this information to help set a strategic goal for 2019. With our goal in place we then moved on to develop tactics (how we would actually get there), and now with tactics in place we simply need to execute on them (and listen to our clients of course) to achieve our goal.
This is the exact same process you should go through at your development office. What is your year-over-year donation retention rate? What about donor retention rate? What is your goal for 2019? Which tactics will support you getting there?
Want to know a secret? We used our very own Fundraising Report Card® to visualize MarketSmart’s data and start the conversation internally. Yes, it is the busiest time of year, but this type of data-driven analysis and conversation is extremely powerful. Plus it’s not inaccessible anymore, simply drag and drop your data and you’re set.
Donor lifetime value
The third metric we measure at year-end is donor lifetime value. Lifetime value (LTV) is another metric I’ve written in depth about in the past and if you are unfamiliar, please take a look at this article or this book.
Lifetime value is a projection of future revenues attributed to a relationship with a client (or in your case, a donor). Kissmetrics wrote a blog post a while back exposing the LTV of the average Starbucks customer. The numbers were staggering.
The average Starbucks customer’s relationship with Starbucks is worth close to $15,000 over its lifetime. $15,000! That’s a lot of coffee!!
We measure our lifetime value annually to make sure it’s trending in the right direction each year.
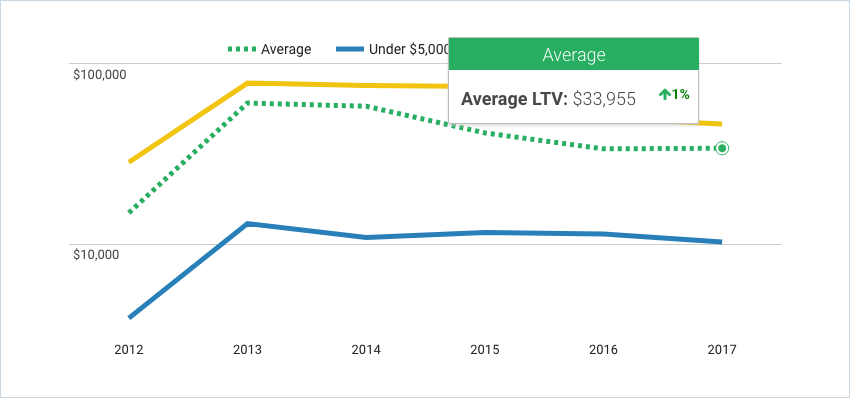
At MarketSmart, we did a visual analysis of lifetime value and then we talked, asked questions, poked holes, etc. You know by now that this isn’t our real data in the chart above, but again, it is similar, and this is the type of visualization we used to drive discussion internally. By the end of our meeting(s) we came up with strategy and tactics that would support us increasing lifetime value and ultimately support our 2019 revenue goals.
Do this very same thing at your shop. Ask yourselves things like: What is your donor lifetime value? Is it going up or down? How can you influence it?
Applying this information
Having data and metrics is one thing, but putting them to use is another.
If you follow my lead and calculate average donation amount, donation retention rate, and donor lifetime value for your organization, you’ll be half of the way towards making 2019 more successful (and data-driven!). But, to make this exercise truly beneficial, you’ll need to do a bit more than calculate some numbers or upload data into your Fundraising Report Card® account. Unfortunately, yes, there is more work to be done, but don’t fret, it’s relatively simple.
You need to talk.
For me, talking comes naturally. I’ll talk up anyone, anytime, anywhere. (Maybe this is why I don’t get invited to our company happy hours?) For you though, you’ll want to share your three key metrics and prompt discussion with your colleagues about the trends you see from your data.
Then, from this discussion (or in the case of our company, many more discussions,) you’ll be able to move into 2019 feeling more strategic, data-driven and most importantly confident in your organization-wide fundraising goals.