

“This is pretty useless for me right now.” No matter what business you’re in, those are words you never want to hear.
“How do you think we can change that? You know we want to help you as much as possible,” I responded.
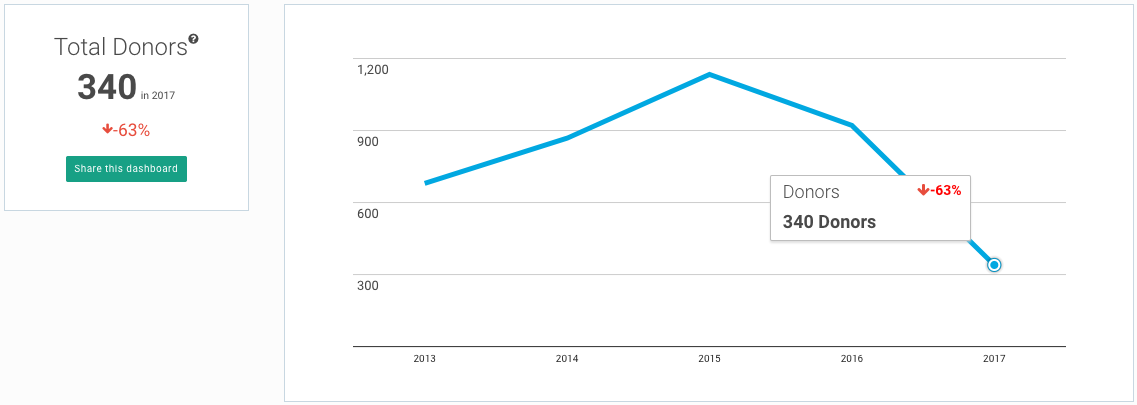
“Let me visualize my fundraising metrics monthly, not just annually. I showed my board these reports five months ago, at the end of the fiscal year, and they loved them. Now they want the same reports again, but my 2017 metrics look terrible because it’s only September.”
Following this conversation… only a few months ago with a long-time Fundraising Report Card® user and executive director, a light bulb went off in my head. Fundraising Report Card® was super useful… at the end of the calendar or fiscal year. But want to show your board the successes you’ve had in the past few months? Good luck.

If you currently calculate your fundraising metrics annually, or whenever a board meeting is coming up, you may want to change that habit after reading this post. In order to develop a data-driven culture in your organization and track your own success before it is too late to make changes to your strategy, you need simple methods of measuring near real-time performance. Today, we will look at two such fundraising metrics that, thanks to the insight of the executive director from our story, are now available to Fundraising Report Card® users today.

Two simple metrics to measure monthly
Let’s stick with the basics. Although it might be interesting to measure month over month changes in donor lifetime value, we will focus on two metrics that are a bit more practical (and easier for your board to understand). They are:
- Donor growth rate
- Donation growth rate
If you’re a longtime reader of this blog, growth rate should not be a foreign concept to you (if it is, please take a look here).
Remember, our goal is to show the board progress over a time period that isn’t “yearly.” Of course, if we were presenting to the board at an annual meeting we would include annual growth rates, but since our objective is to show progress over a shorter period of time we’ll focus on month over month, or quarter over quarter changes in growth.
As a brief refresher, you calculate growth rate with one simple formula:
Rate = ((x – y) ÷ y) × 100
If we needed to calculate our August donor growth rate, “x” would be the count of “August 2017 donors,” and “y” would be the count of “August 2016 donors.” Imagine this year we had 100 donors in August, and last year we had 50.
August Donor Growth Rate = ((100 – 50) ÷ 50) × 100 = 100%
In this scenario donor growth increased by 100% in August. Now that’s something worth showing the board!
To share donation growth rate, simply substitute “count of donors” with “sum of donations.” So let’s say we had $15,000 in donations in August 2017 and $10,000 in donations in August 2016.
August Donation Growth Rate = ((15,000-10,000) ÷ 10,000) x 100 = 50%
Donation growth rate increased by 50% in August.
As you can see, calculating growth rates is pretty easy if you have access to clean and accurate data.
How to present these metrics
Now that we have our metrics and we know how to calculate them, the hard part becomes presenting them. This is where the Fundraising Report Card® can help.
Your board appreciates visual reports, I’ve written about that concept in the past. So, with your month over month metrics you’ll want to provide them with something visual.
Let’s say you’re like our fundraiser from above, and you want to show the progress you’ve made over the past five months. I would not recommend sharing quarterly growth metrics (because five months only encompasses one complete quarter), but instead focus on month over month changes.
Load your most up-to-date data into your Fundraising Report Card® account and navigate to the Growth Dashboard. Next, toggle the “Annual” field to “Monthly,” and then “January.” Scroll down, and voila you have your January Donation Growth rate. Print, share, or screenshot the image to show your board how you’ve progressed this January compared to last.

Then, do the same with your other months. February, March, etc. Take the visualizations and put them into a powerpoint or print out to share them with the board. Your talking points are the graphs. If they are going up and to the right, you’re in for a fun meeting! If they’re going down or plateauing, it might be a more sobering experience, but by tracking these metrics month over month, you now know that it’s time to do something about it.
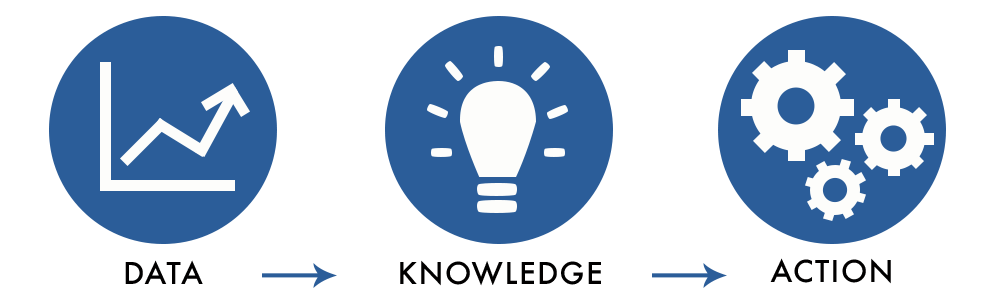
Remember, data doesn’t lie, it simply tells a story and it’s within your power to change the ending .
Applying this at your shop
Measuring fundraising effectiveness isn’t difficult. Most organizations and leaders focus on annual progress and, although that is the best place to start, if your board is interested or if you know you’ve made great progress and want to show it, monthly growth metrics are worth measuring too.
Just two easy-to-calculate and visualize (with the help of FRC) numbers can help make sure your strategy is working and that you’re on course to hit your goals. You don’t need to worry about getting in too deep over your head, you can simply start with the basics. There’s nothing wrong (and everything right) about that.
Happy analyzing!