Applying Concepts with Direct Mail Metrics
Part 6 of 6 in Our Data-Driven Fundraiser’s Reference Guide
On this page
Bringing everything together
Culture and infrastructure
Who should I mail to?
How do we test this?
How to measure effectiveness
Okay, but really, who should I mail to?
Long term planning
Bringing everything together
Well, dare I say it, we are finally here at the last section of the Data-Driven Fundraisers Reference Guide. We’ve covered a lot up to this point. If you missed a section or two you can always reference the beginning of the guide to find links to all of its sections.
Today, we will take bits and pieces from all the previous parts of the Data-Driven Fundraisers Reference Guide and walk through a real-world example. We will go through a step-by-step case study of sorts.
My hope is that after reading this section you will feel more confident in your ability to produce data-driven fundraising campaigns, and measure their effectiveness in both the short and long-term. We’ve covered a lot leading up to this final section of the guide, and this is the part that ties everything together.
Let’s get started!
Get Data-Driven Fundraiser Email Updates
Culture and infrastructure
Think back for a moment to part one of this guide. In that section we talked in depth about two overarching themes: culture and infrastructure. In order for data-driven practices to take place, you need an organizational culture that not only accepts questioning the status quo, but endorses it. You’ll also recall that in order to effectively measure and monitor metrics you need infrastructure that supports your quest to dive deeper into your data.
Steve MacLaughlin goes into much more depth on the importance of culture in his book, Data Driven Nonprofits, but I took away one key passage from his writing.
Steve suggests that there are “ABC’s of data-driven culture adoption.” They are:
- Acknowledge the current culture
- Baby step behaviors
- Culture aligns with strategy
Our culture conversation leads us to one of the most challenging problems nonprofits face when trying to shift towards being data-driven: the lack of infrastructure to efficiently and effectively carry out tests, record data and validate hypotheses.
We discussed the chicken and egg problem back in part one. You need an organizational culture that endorses questioning, testing and measuring. At the same time, you need the people, tools and resources to actually to do that effectively.
Back in part one, I suggested that you try to bring together a data-driven culture and infrastructure at the same time.
Let’s actually go about doing that now in this example…
Who should I mail to?
Before we go too far into this direct mail case study, let’s define what type of direct mail appeal we are sending. For the purposes of this walkthrough we will be preparing and measuring the results of a renewal campaign, not to be confused with an acquisition campaign.

Now, think back to our definition of data-driven fundraising: fundraising that is compelled by data, not intuition or gut-feel . We went as far to suggest that data-driven fundraising is simply the application of evidence-based practice (EBP) in the fundraising field. We defined evidence-based practice as being characterized by three core components:
- Having a question about something
- Testing that something
- Recording and measuring the results of that test
Okay, with all of that in mind, let’s establish our goal. Once we do that, we can figure out what our question is (first core component of EBP).
For the purpose of this example, let’s say our goal is to maximize our return on investment. If we’ve budgeted $2,500 to spend on direct mail renewal appeal then we’d like to see a return on that investment that far outnumbers $2,500 in both the short and long run.
The first question that comes to mind for me is, “Which segment of donors should we send a direct mail renewal appeal to?” With $2,500 to spend, focusing in on the right subset of donors will be critical for maximizing ROI. I’ve never been a huge advocate for throwing stuff against and a wall and seeing what sticks, and with only $2,500 to spend, that would be a poor use of budget.
The only way to get a data-driven answer to this question is to test-send appeals to different segments of our donors and see how they perform. Of course, we will need to record and measure the results of those tests to determine which segment deserves our full investment and attention.
How do we test this?
This webinar conducted with NeonCRM goes in depth on the concepts of segmenting your donor database.
Let’s begin by defining our testing segments.
I’ve preached in the past about how your donors’ historical giving data can be mined for insights into their trends and behaviors. Segmentation by giving level (i.e. under $100 or over $1,000), and segmentation by performance metrics (i.e. retained, acquired, reactivated), can be leveraged to create personas for your constituency.
Since our question is “Which segment of donors should we send a direct mail renewal appeal to?” I would immediately gravitate towards these three basic segments:
- Newly acquired donors giving $1,000 or less
- Retained donors giving $1,000 or less
- Reactivated donors giving $1,000 or less
I would test these segments because acquired, retained and reactivated donors all have different “stories.” Each segment of donors has a different reason for why they contributed to your organization. These different stories could potentially have huge implications on how well they receive and respond to a direct mail appeal. For example, you may find that your retained donors prefer a phone call over a piece of mail.
Who knows? That’s what we are about to test and find out.
A few paragraphs earlier we briefly discussed the importance of infrastructure. Now let’s put more meat on the bones.
There are a few tools I’d recommend having access to at this point:
- Your donor management system
- Fundraising Report Card® account
- Excel or Google sheets
If you can, export and load your donation data from your donor management system into your Fundraising Report Card® account. Head over to your acquisition dashboard, then retention dashboard, and finally your reactivated dashboard. On each, export lists of all donors under $1,000. (If you need help doing this, take a look at our Help Center documentation or use the live-chat to get support.)
Take those lists and merge them with your donor management system in Excel or Google sheets.
You should now have your three lists to test, and hopefully that took only 30 minutes or so. It’s important to note that in order to test these three lists you will need to negotiate a small preliminary send with your direct mail firm. They will need to send your appeal to a subset of each of the segmented lists. Once they have done that, we can measure the results of the preliminary send and determine where the rest of your investment will go.
Get Data-Driven Fundraiser Email Updates
How to measure effectiveness
How do you know you are measuring the right metrics? Harvard Business Review has a great article titled, Beware of Vanity Metrics. It’s worth a read in addition to this section of the guide!
We’ve come up with our data-driven question, segmented our database into three lists and are one step closer to sending out our direct mail renewal appeal. But first, we need to crown a winner of our preliminary send. How do we know which segment performed best?
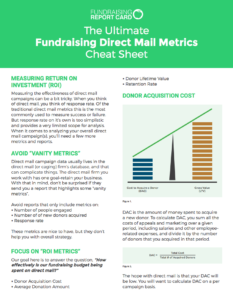
When it comes to planning and measuring the success of a direct mail appeal there are really four key metrics to measure.
However, before those metrics, there’s one concept that we have to briefly discuss: vanity metrics. Vanity metrics are what they sound like – metrics that appear nice, but don’t actually help you with strategy.
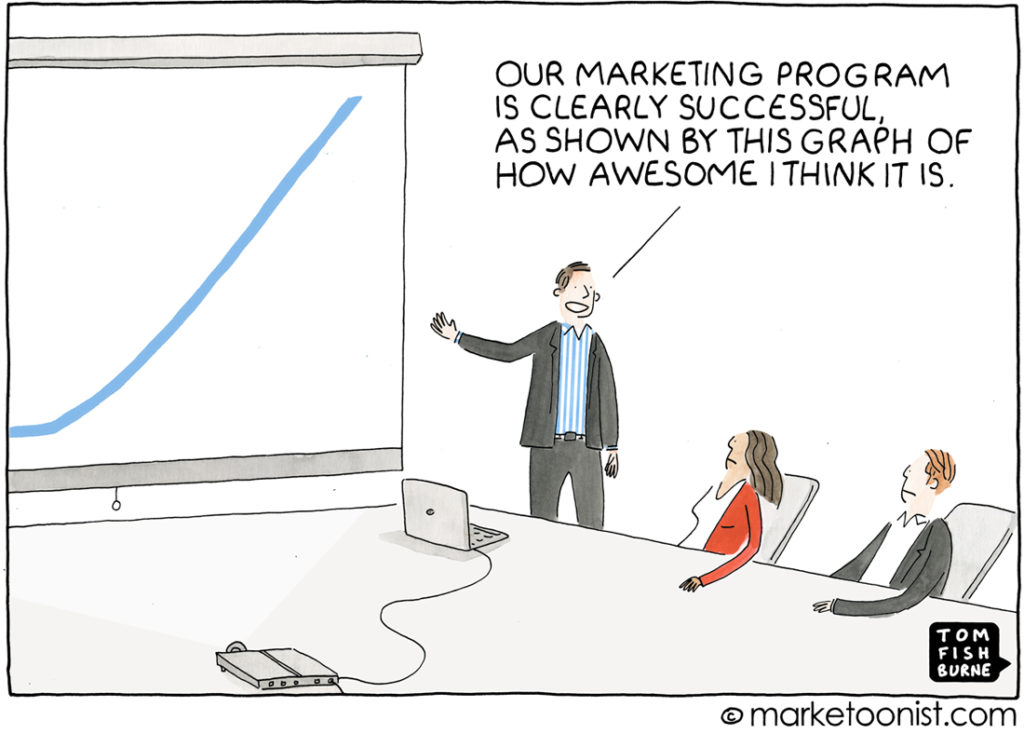
Vanity metrics are dangerous. In our quest to be data-driven, we need to focus on information that is useful and dispose of data that takes away our focus.
When it comes to direct mail this can be tricky. Not because our analysis is overly complex, but rather because the data we need to analyze is in the direct mail (or caging) company’s database.
Analyzing direct mail performance is tough. If you’ve done direct mail appeals in the past you may be familiar with reports from the 3rd party vendors that tout how successful a campaign was. You might recognize sentences that read, “you received an above industry average response rate of 2%, and we received donations from 118 donors who renewed.”
If you have access to these reports, be wary. I’m not suggesting the statistics are inflated or false, I highly doubt that. Rather, it is important to recognize that these are simply vanity metrics.
When it comes to measuring fundraising return on investment, response rate and renewed donors are too simplistic and provide an extremely limited scope for analysis. Neither one of these metrics on their own can truly benefit you and your team when it comes to measuring return on investment.
That is where our four metrics come in.
Our four metrics are actually broken down into two sets. For short-term analysis we will analyze:
- Donor acquisition cost
- Average gift amount
And for long-term analysis we will look at all four:
- Donor acquisition cost
- Average gift amount
- Donor lifetime value
- Retention rate
Donor acquisition cost

We’ve talked about donor acquisition cost (DAC) at great length in this guide. If you didn’t read part three, please take a look now.
As a refresher, DAC is the amount of money spent to acquire a new donor. To calculate DAC, you take the sum all the costs of appeals and marketing over a given period, potentially including salaries and other employee-related expenses, and divide it by the number of donors that you acquired in that period.
In the context of a direct mail renewal campaign DAC may seem pointless. “We’ve already acquired the donor, we already know their DAC.” This is true to a degree. You know their acquisition cost from last year, but what about this year?
When it comes to renewal you will absolutely want to track donor acquisition cost. It may help to think of renewal as simply re-acquiring the same donor. There are still costs in that effort.
DAC = Total costs ÷ Total # of acquired donors
I recommend tracking donor acquisition cost because it takes into consideration response rate, but also puts things in terms of dollars spent. For example, if one of our three segments has a drastically higher response rate than the other two, it will have a much smaller DAC. As response rate goes up, DAC will go down. But looking at DAC instead of response rate will give us a dollars and cents perspective on how much we can afford to spend on mailers.
DAC simply helps frame your return on investment mindset in a way that response rate can’t.
Average donation amount
The second metric we will want to calculate is average donation amount. Again, we will want to do this for each of our three segmented lists, just as we did with DAC.
If we only measured DAC we might get tricked into thinking that the lowest acquisition cost list is the best list to send to. You’ll recall that we always want to interpret donor acquisition cost with donor lifetime value, yet in this case, since we are only analyzing our donors behavior over the course of one transaction, we will use average gift amount.
We’ll want to compare our three segmented lists by both of these metrics to gauge which has low acquisition costs and high donation amounts.
In the long-run we will also want to consider two more metrics: donor lifetime value and donor retention rate.
Donor lifetime value

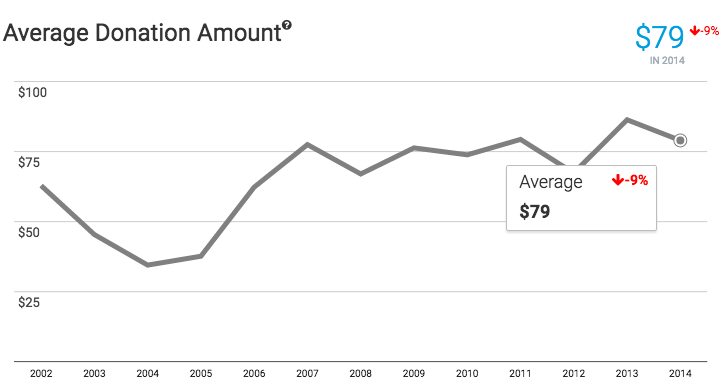
As we’ve talked about in the past, donor lifetime value (LTV) is more telling than average gift amount. Where average donation amount provides you with a snapshot in time (the size of an average gift at this exact moment), donor lifetime value tells you a more compelling story (the amount of revenue an average donor produces over the lifetime of their giving).
During our preliminary send to the three lists we cannot calculate lifetime value. But in the long-run, over the next 3-5 years, we will want to track the LTV of each segmented list. That is how we will be able to track the long-term return on investment we are looking for.
You might recall that calculating LTV can be a bit difficult. The formula is straightforward, but getting some of the inputs (donor lifespan for example) can be tough.
LTV = Lifespan × Average donation amount × Frequency of donation
But remember, this is one of the metrics that the Fundraising Report Card® will calculate for you. You’ll find LTV on the same page as average donation amount, making it easy to analyze both at the same time.
Donor retention rate

Last but not least is retention rate. How many of our direct mail donors are sticking around and donating next year or the year after that? Even when considering a direct mail renewal campaign it is important to track retention rates. Don’t assume that just because a donor made a contribution to your organization last year that they will do the same this year.
You’ll want to track and measure retention rates over the next 3-5 years to figure out which segment of your donors are sticking around and which are lapsing.
Keep in mind, this is another one of the many metrics the Fundraising Report Card® calculates for you. You’ll find it on the Retention Dashboard page.
Okay, those are our metrics. Four in total, but two that we are going to focus on for right now.
Okay, but really, who should I mail to?
You’ve come this far! Now, let’s see how we did with our renewal campaign.
Our preliminary send went to three segments:
- Newly acquired donors giving $1,000 or less (list A)
- Retained donors giving $1,000 or less (list B)
- Reactivated donors giving $1,000 or less (list C)
Within a month or two of sending the preliminary appeal, calculate the donor acquisition costs and average donation amounts.
Before we get into the equation, let’s assign a few constants:
- The direct mail firm sent 250 appeals to each of the segmented lists (750 mailers total)
- The cost per piece of mail is $.65
- Total cost (excluding salaries and overhead) is $162.50 per list (250 x $.65)
- List A had 25 renewed donors
- List B had 50 renewed donors
- List C had 75 renewed donors
Let’s start by calculating DAC. We know our total cost is $162.50 per list. What we are really interested in is plugging in the number of acquired donors. Let’s imagine our test played out like this:
DAC of list A = $162.50 ÷ 25 = $6.50
DAC of list B = $162.50 ÷ 50 = $3.25
DAC of list C = $162.50 ÷ 75 = $2.16
We can see that acquisition costs were lowest for list c, coming in at two dollars and sixteen cents.
Next let’s take into consideration the average donation amount of each segmented list. Remember, average donation is simply (all donations / total # of donors). For our purposes, here are a few more constants:
- List A had total donations of $1,500
- List B had total donations of $2,500
- List C had total donations of $1,500
Average donation list A = $1,500 ÷ 25 = $60
Average donation list B = $2,500 ÷ 50 = $50
Average donation list C = $1,500 ÷ 75 = $20
Great. Now how do we choose which segmented list we are going to send the rest of the mailers to? Let’s do a bit of analysis.
Sending to list A incurred the greatest donor acquisition cost, $6.50 per acquired donor. But that was partially made up for by having the largest average donation amount, $60.
List B was right in the middle for both of our key metrics, and list c had the lowest DAC, but also the lowest average gift amount by far.
They all seem like viable options, how do we choose just one to send to?
Ratios. To be more specific, unit ratios.
List A
For every $6.50 we spend on list A, we will receive $60 in donations. That’s a 6.50 : 60 relationship.
That doesn’t really help us. But if we divide our ratio by 1 (in terms of our denominator, 60/60) we get a unit ratio.

Ultimately this ratio can be interpreted as, for every $.11 spent we will generate $1 if we send to list A.
Let’s see what our unit ratio comes out to for lists B and C.
List B
For every $3.25 we spend on list B, we will receive $50 in donations. That’s a 3.25 : 50 relationship.
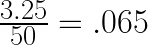
For every $.065 spent we will generate $1 if we send to list B.
List C
For every $2.16 we spend on list C, we will receive $20 in donations. That’s a 2.16 : 20 relationship.

As with list a, for every $.11 spent we will generate $1 if we send to list C.
Now things look more clear. List B is the obvious choice. Based off of our two key metrics and our unit ratio we can see that for every $.065 spent on list B, we will generate $1. That’s a fantastic short term ROI.
Things become more interesting over the next 3-5 years as you can analyze how the segment performs in terms of retention and lifetime value. But nonetheless, key metrics and unit ratios are your tricks of the trade when it comes to figuring out who to actually send to.
Long term planning
So how do we apply these concepts to long-term planning and strategy? This walkthrough example may be nice and helpful in wrapping your head around what data to analyze before your next direct mail appeal, but how do you incorporate these concepts in your organization’s long-term plans?
It goes back to culture and infrastructure. The only way you can scratch the surface of what we outlined above is if you have leadership that supports testing and tools that enable analysis.
Your database is full of great information. You should be able to scrutinize previous all previous data and come up with segments for your own for testing. It’s my hope that this guide will be a useful resource for you and your team as you analyze, test and validate your hypotheses. And remember, take advantage of new technologies!
Fundraising Report Card® is free. Join today and get started on your data-driven quest!
Get Data-Driven Fundraiser Email Updates
NOTE: Thank you Jennifer Willett, Cheryl Papsch and Lizzie Weiland for editing this section of the guide.
Take me to part 5Take me to the Intro