Yesterday, The Giving Institute published their 2017 Annual Report on the state of philanthropy in the United States. We’ll review their findings here in a moment and discuss what implications they might have on you and me, but first we should take a brief pause to thank those involved in producing this much needed research.
Although mentioned only in the last section of the official press release, I think it is important that we acknowledge the time, resources and energy that the Giving USA Advisory Council on Methodology, the staff at Indiana University Lilly Family School of Philanthropy, and the staff at the Foundation Center donated to produce this necessary and vital research. Thank you to all who contributed.
Okay, now onto the fun stuff.
Key findings
Total charitable giving grew 2.7 percent year over year for 2016 . Compare that to 4.1 percent growth in the prior year over year comparison for 2015, and 5.4 percent for 2014.
Total dollars donated rose to $390.05 billion in 2016, from $379.89 billion in 2015 . For back to back years charitable giving has surpassed pre-recession, high-water marks for giving. For perspective, in 2007, total dollars donated was an inflation adjusted $355.17 billion.
Individual donors contributed 3.9 percent more dollars in 2016 than they did in 2015. This is similar to the 3.8 percent growth rate in 2015, and much lower than the 5.7 percent growth rate in 2014.
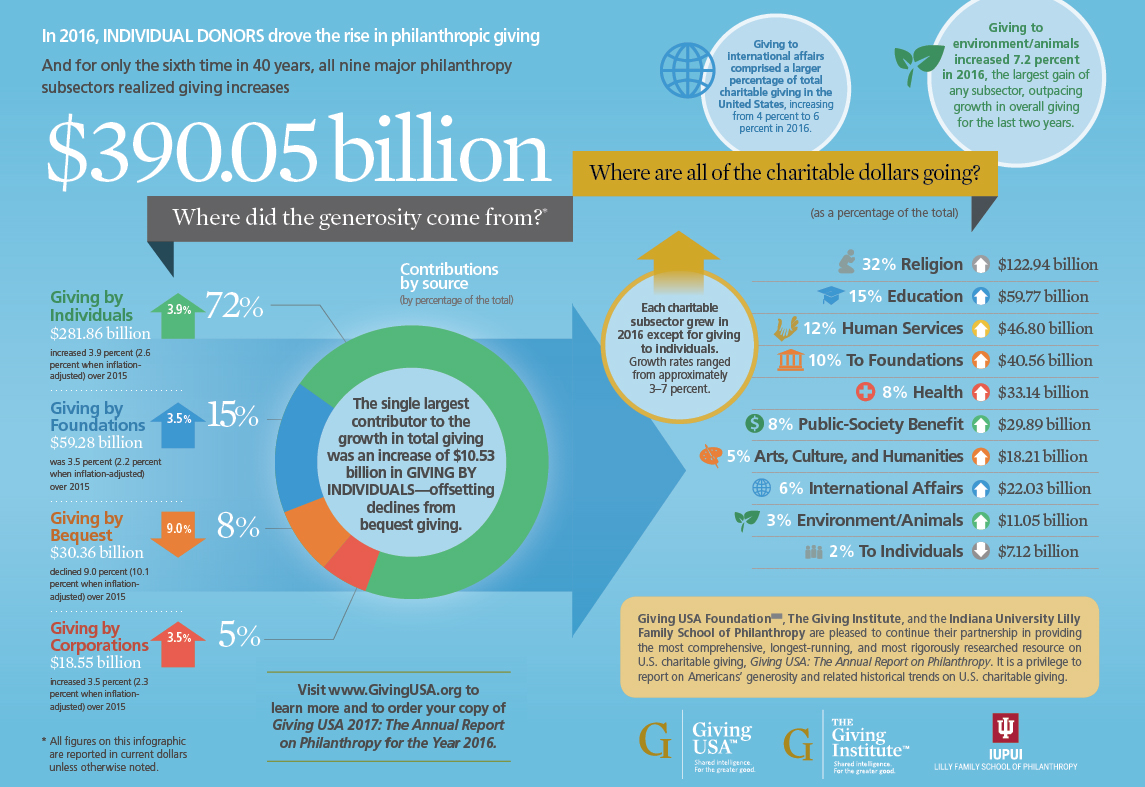
The share of total giving from individual donors was 72 percent (72 percent of $390.05 billion came from individual donors). This number has been stagnant for the past few years, either at 71, or 72 percent.
The share of total giving from foundations was 15 percent, again similar to prior years. Yet the amount of contributions (the actual dollars raised through foundations) grew more slowly than in years past, 3.5 percent in 2016 vs. 6.5 percent in 2015.
The share of total giving from bequests was 8 percent, similar to prior years. Yet, just like foundation contributions, the growth (or in this case decline) in contributions from bequests was surprising.
Total dollars raised through bequests was $30.36 billion in 2016, down from $31.76 billion in 2015.
The share of total giving from corporations was 5 percent, again par for the course. Total giving from corporations was up slightly, from $18.45 billion in 2015 to $18.55 billion in 2016.
Giving to arts, culture, and humanities organizations increased 6.4 percent to $18.21 billion in 2016, from $17.07 billion in 2015.
Giving to international affairs organizations increased 5.8 percent to $22.03 billion in 2016, from $15.75 billion in 2015.
Giving to environment and animal organizations increased 7.2 percent to $11.05 billion, from $10.68 billion in 2015.
3 Key Takeaways for You and Your Organization
1. Steady as she goes
All in all, this year’s annual report doesn’t have anything too “explosive” hidden in it. Instead, the 2017 Annual Report seems to suggest that charitable giving is sailing along quite steadily. Post recession increases in giving have been modest but consistent, and mirror the modest but persistent increase in GDP.
If your organization serves arts, culture, humanities, international affairs, or the environment and animals you should take note of the more rapid increase in giving in your specific sector. As political and social uncertainty wane on the United States’ collective psyche, this may be a time to capitalize on increased giving to these types of organizations. The Annual Report seems to indicate that a more rapid increase in giving to these particular sectors was occurring in 2016, and one would think they would most likely continue into 2017.
As for the other sectors outlined in the report, growth rates are more in line with overall growth rates (2.7 percent). With that in mind, there may not be as much momentum to justify increasing fundraising goals for the upcoming fiscal year.
2. Giving from bequests is uncertain
Planned giving and legacy contributions were down 9 percent in 2016. Yet as the Giving USA Report notes, that is not a sign of the beginning of the end for bequests, as “gifts in the form of bequests frequently fluctuate from year to year and are less influenced by economic factors.”
That being said, this year’s Annual Report is evidential support for why your organization should be investing in planned giving. Although uncertain, (it is difficult to predict when someone will pass) planned giving can and eventually will have a large impact on your organization’s bottom line. One approach to legacy giving that I have become fond of is the concept that all planned gifts are not factored into annual goal setting or budgeting. Essentially, the idea is that all other giving streams should account for the operating expenses of the organization. Then, when a planned gift does come to the organization it can be treated like surplus revenue and help the organization sustain itself into the future.
Remember, legacy contributions tend to be large (although the research is outdated, the best estimate for planned gift size is between $35,000 – $70,000) so one or two realized bequests can have a meaningful impact on your organization. This is also why the Giving USA Report fluctuates so much with regards to bequests. If a handful of really wealthy people pass away, their contributions could drastically alter the “growth in giving” from bequests.
Although uncertain, legacy giving still needs to have a place at your organization. Take this industry data to your team to start and further that discussion.
3. These are the types of key performance indicators (KPIs) and metrics you should have on hand
Although the Giving USA Report lacks any blockbuster statistics, one of, if not the most important takeaways from this research is the realization that these statistics and metrics are the exact same KPIs and metrics you should have regarding your own donor database.
Overall growth rates, growth broken down by giving level (under $100 donors vs. $1,000+ donors), and growth broken down by source (check vs. online) are all metrics you should be analyzing. There is a reason a large group of smart people come together once a year to produce the Annual Report; it’s to help the sector gauge in which direction things are trending to set realistic expectations for the upcoming year’s goals and objectives. And that is the exact same reason why you, at your organization, should want to have your KPIs on hand.
If you haven’t already, take a look at the free tool we’ve built here at Fundraising Report Card®. Here’s an example growth report you’ll be able to get your hands on in seconds after you upload your data.
All in all, 2016 wasn’t too much different from 2015. Charitable giving grew. Nearly every sector experienced year over year growth, and individual giving continues to climb. Kudos to you, fundraising staff. Keep doing what you’re doing.
Click here for the 2014 report.
Click here for the 2015 report.
Click here for the 2016 report.
Zach, the big take away consistent with your other posts is right there, you are missing the biggest opportunity to bring it all together with the results of this report.
What is the missed opportunity?
First paragraph: “discuss what implications they might have on you and I”. Should read, “you and me”. My pet peeve. Back in the 90s, grammar advocates were admonishing people not to say “Martha and me went to the mall”, and in trying not to sound uneducated now people have swung the other direction and use “I” too much instead.
Otherwise great article. Thanks for letting me rant. 🙂
Thank you, Fay! I’ve updated the post 🙂
I’m glad you enjoyed the article. Thanks again!
Looks like Foundation in the chart should be -3.1 percent, not up, unless the figures are in the wrong columns?
You’re 100% right, Ellen. We’ve updated the table. Thank you!
Zach, I am very grateful for the momentous efforts you make to keep those of us in the sector apprised and helpful to get your analysis as well. Keep up the great work you’re doing.