Our new series Metrics 101 will be published weekly. In the series, we will define fundraising metrics, outline analysis tips and tricks and highlight different ways you can take metrics and present them to your staff, colleagues and board.
For our first installment of the series we are going to focus on the basics: donor and donation growth. When it comes to measuring fundraising effectiveness, donor and donation growth are two metrics that should immediately come to mind.
What is donor and donation growth?
Defining growth is relatively simple: it is the increase in size of something over a period of time.
In our case, we might look at the increase in size of donation revenue year-over-year. We could just as easily look at the increase in size of the number of donors month-over-month. Both are measures of growth with a simple change of variables (donor or donation and time period).
When it comes to measuring donor and donation growth it is crucial to calculate these metrics across different time periods. For example, you will want to know both your monthly growth in donations and donors, as well as your annual growth in donations and donors. This will give you more opportunities to glean insights from the data –we’ll get more in depth later in this article.
How do you calculate donation growth & donor growth?
We are actually going to calculate four growth metrics.
- Donor count
- Donation count
- Donor growth rate
- Donation growth rate
Donor and donation counts are simply the sums of all donors or donations during a period of time. For example, donor count would be all donors in 2015, and donation count would be the sum donation revenue in June 2016.
To calculate donor and donation growth rates, you first need to calculate your donor and donation counts.
Your donor growth rate equation will look something like this:
Donor Growth Rate = ((2016 donors – 2015 donors) ÷ 2015 donors) × 100
The first part of the calculation, (2016 donors – 2015 donors) is used to determine the increase from one year to the next.
Then, the division and multiplication, ÷ 2015 donors and × 100 are used to convert your increase into a percent relative to last year.
To calculate donation growth rate your equation will look similar, just with different counts.
Donation Growth Rate = ((2016 donations – 2015 donations) ÷ 2015 donations) × 100
If you have access to your CRM or database you should be able to calculate these metrics fairly easily.
Why calculate donation growth & donor growth?
Think of donor and donation growth metrics the same way you think about a stoplight. When you are driving and come to a red light you know to stop. If the light is green you move right ahead, and if it is yellow you make a decision on how to proceed.
Your donor and donation metrics should inspire similar behavior. If your donor growth is negative (losing donors year over year) that would be a red light signaling you need to stop and reassess.
If your donation revenue is growing substantially year-over-year, that would be a green light telling you to keep moving ahead with your current strategy.
Donor and donation growth metrics won’t tell you exactly what is going right or going wrong, rather they will provide a high-level overview.
Metrics are meant to help you identify what needs to change. Donor and donation growth metrics will point you in the right direction.
How do I use donation growth & donor growth?
Leveraging donor and donation growth metrics comes down to presentation. A lot of Fundraising Report Card® users have shared stories with us about printing their growth rate reports and passing them around during weekly development meetings.
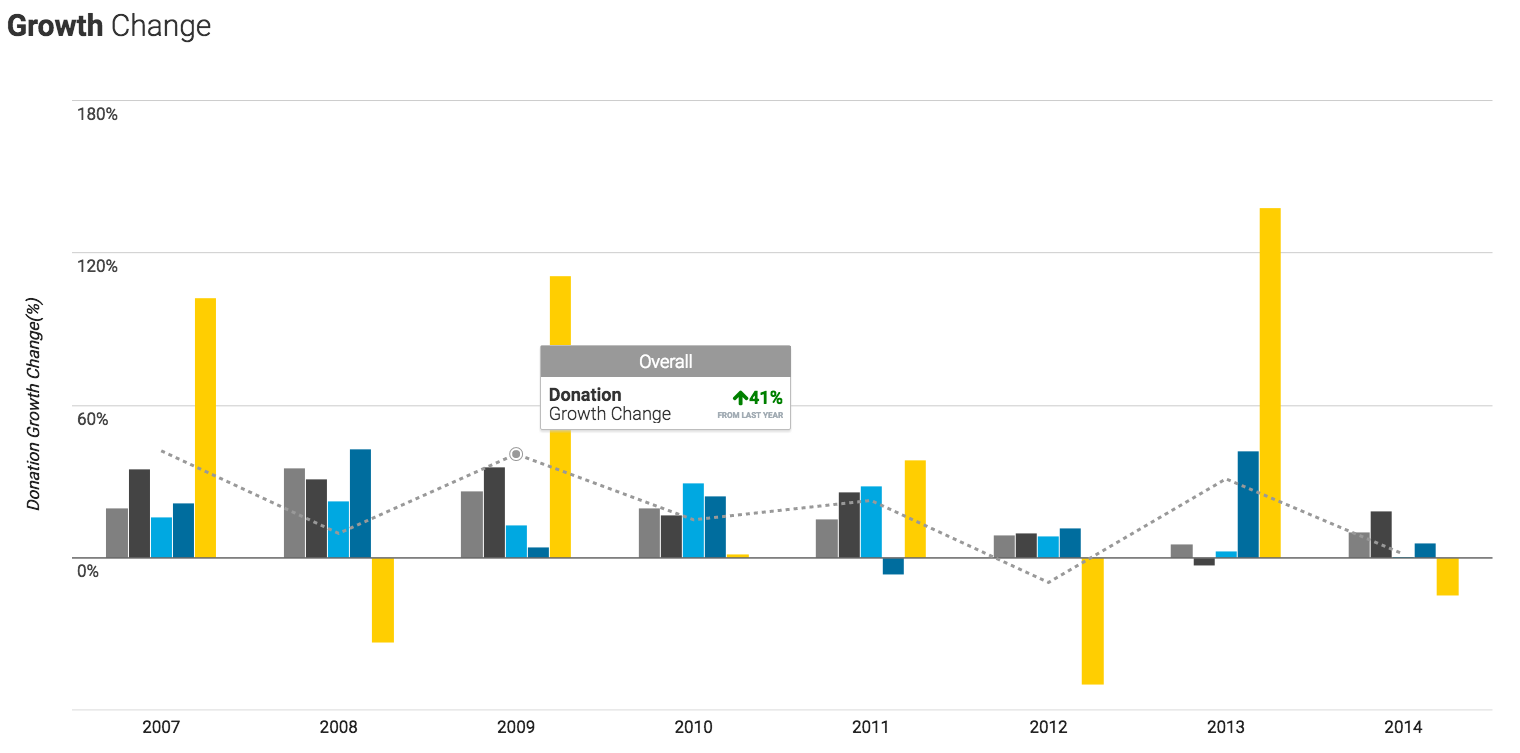
Percentages and numbers mean a lot, but for most people, looking at graphs and visualizations are easier to comprehend. When it comes to looking at donor growth rates we all know that -5% is bad and 50% is good. But having a graphical representation makes the point all the more clear. It can also help you identify trends over longer periods of time as well.
Calculating donor & donation growth and more with a single click
If the thought of calculating donor and donation growth (or any other metric for that matter) by yourself is daunting, check out the Fundraising Report Card®. We provide one-click, simple-setup fundraising analytics & insights.