
Google search “annual fund key metrics” and you’re greeted with approximately 2.5 million results. Unfortunately, the first few pages (and I imagine the the ones that follow) don’t really have the information you’re most likely trying to find.
Sure, “20 Key Performance Indicators Nonprofit Management Needs to Track” is on the first page, and so is an article from case.org. Both are interesting, but neither hits the mark. You google searched “annual fund key performance metrics,” not “the top metrics,” or “general metrics strategy.” Yet, both of those top page results are focused on only those two topics. That’s a shame because leadership among different departments need to hold themselves accountable to far more than just two kinds of metrics.
There are several considerations that need to be made when reviewing key performance indicators. For instance, planned giving key performance indicators (KPIs) are not the same as annual fund KPIs. Aggregating data from all of your organization’s departments and suggesting it’s a more holistic and comprehensive assessment of “organizational performance” also is unfair to individual departments.
What happens if a large bequest comes in this year? Does the annual fund team get to take some credit for that? When the data is grouped together it can be hard to attribute gains and losses to specific departments and individuals. (I’m not suggesting that departments “compete” with one another, or fight to take “credit,” but holding one another accountable is important, and not having an accurate measurement of your department’s KPIs makes this more difficult.)
Different fundraising departments have different key performance indicators. Today we’ll explore a few example KPI metrics you may want to consider across individual fundraising departments. But wait! If you are reading this and thinking to yourself, “We don’t have any departments, our fundraising team is three people,” please bookmark this page and read this article instead.
If you are part of a larger organization with defined fundraising departments, please continue on. We are going to discuss KPI metrics for two distinct departments within your organization: annual fund and major gifts. Stay tuned for a separate article on planned giving and capital campaign KPIs in the near future.
But for today, we’ll simply outline two KPIs you should consider tracking and reporting each year. These KPIs should be part of your larger assessment of departmental effectiveness and success.
Let’s jump in.
Annual fund KPIs
Unlike other fundraising departments, the annual fund team is most likely flooded with data. Direct mail acquisition, online marketing, fundraising events, etc. — all of these activities produce data which can be analyzed and scrutinized. Though the annual fund team has more than two KPIs to report come year-end, here are the two I would focus on.
- First-time donor retention rate
- Donor upgrade rate
First-time donor retention rate
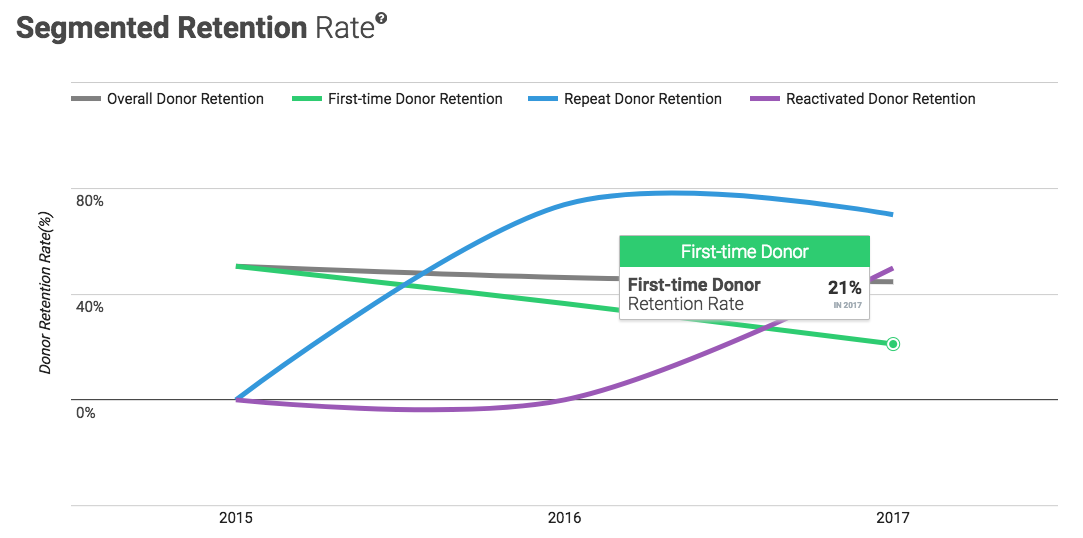
A segment of overall donor retention rate, first-time donor retention rate is a measure of how well your organization is maintaining relationships with newly acquired donors the next year. Whereas overall donor retention scrutinizes how well you are retaining all donors year-over-year, first-time retention rate only considers newly acquired donors.
Why is this a KPI for the annual fund team? Why not plain old retention rate? There are two simple reasons. Overall donor retention rate is an organizational KPI metric. A lot of other folks play a role in what that metric ends up looking like come end of year. First-time donor retention will illuminate any underlying “issues” that may otherwise be overlooked or not noticed when analyzing other retention metrics.
For the annual fund, donor acquisition is a primary goal. But, even with that in mind, retention cannot be forgotten. First-time donor retention rate is the perfect KPI to measure how well the annual fund team pursues both acquisition and stewardship. Acquisition is “exciting” and more “fun,” but having goals and rewards for boosting first-time donor retention rate will prove more beneficial for the organization as a whole.
As more first-time donors become “retained” donors, other key metrics will increase. Donor lifetime value will grow larger and ultimately the bottom line will increase as well.
Donor upgrade rate
If you’re retaining donors, that’s great! But, how much did those donors give the second time around? Donor upgrade rate is the rate at which retained donors increase their giving year-over-year. For example, if you had 100 retained donors this year and 50 of them “upgraded” their giving, you would have a donor upgrade rate of 50%. Half of your donors increased their giving year-over-year.
Donor upgrade rate goes hand-in-hand with donor retention rate (and especially first-time donor retention rate) because it exposes the actual behavior of your retained donors. If you have 90% donor retention rate, but 5% donor upgrade rate, you have a lot of retained donors that are either giving the same year-over-year or decreasing their amount of giving. Either way, that’s a sign to dig deeper and figure out why that is happening.
But on the opposite end of the spectrum, if you have 40% donor retention rate and 90% donor upgrade rate, it’s clear you are doing something right. For one reason or another (this is where you do a more thorough investigation) your retained donors are increasing their giving year-over-year. Hopefully you’re thinking to yourself, “How can we make sure this happens again next year, what are we doing right?”
Measuring and reporting donor upgrade rate as a KPI makes sense for the annual fund team because it’s so involved in acquisition efforts and engages with primarily low-dollar donors. If your upgrade rate is high, that could be a good sign for your mid-level donor stewardship efforts. Annual fund donors who upgrade to mid-level donors, and then upgrade to major donors? That’s a fundraiser’s fantasy! But, tracking this key rate will help make sure you get there.
Pro tip
Keep in mind that for both of these metrics we can (and should) break them down by channel. First-time donor retention rate is interesting when scrutinizing all of our donors, but we should also consider what our first-time donor retention rate is from the subset of donors we acquired through Facebook ads, for example.
This way we get a more clear picture of which channels are “working” and which channels are not. If first-time donor retention rate is 10% lower for a particular channel it may suggest that the type of donor you are acquiring from that channel simply isn’t interested in sticking around. Or, it might suggest that you need to steward those types of donors a bit differently.
But, for the purposes of reporting KPIs to leadership, you will most likely stick with overall calculations. Keep the channel segmented metrics to your team internally (for strategy and tactical purposes) and share the more “high-level” overall KPIs with your board and senior leadership. They don’t need (or really care) about the nitty-gritty, they’d much rather prefer to see a chart moving up and to the right.
Major gifts KPIs

With annual fund we’re primarily concerned about donor retention, and as such, our KPIs reflect that. Yet with major gifts, our attention turns from retention toward the moves management process.
Annual fund is concerned with engaging and involving as many low-dollar donors as possible, major gifts is the polar opposite. Give me 150 (less, please) prospects to engage with during a year and I’ll raise some major dollars. That is the mindset of a major gift officer, and their KPIs should reflect that.
With that in mind, our two major gifts department KPIs are:
- Donation amount vs. donor capacity
- Number of moves per month
Donation amount vs. donor capacity
Our ultimate goal as fundraising professionals is to receive donations. Pretty simple, right? But when it comes to major gifts, evaluating how “successful” a donation was can be a bit more involved.
For example, let’s say you recently received a $50,000 donation from a wealthy alum. In a vacuum, that $50,000 donation is amazing. That’s $50,000 more than you had before. Awesome.
But, what if the donor had an expected capacity of $5,000,000 and she recently made a donation that size to a different organization earlier in the year. Does that $50,000 donation seem as great anymore?
Sure, the numbers may be inflated (substitute five million with five hundred thousand), but the story still has the same meaning. When it comes to major gifts, one of the KPIs you should be most comfortable reporting is donation amount versus donor capacity.
From my experience talking with major gift staff, it is common practice to either have a “capacity amount,” or wealth-screened “wealth amount” associated with each donor in a major gift officer’s portfolio. Once a donation has been received from a prospect, take the amount of the donation and compare it to the capacity amount or wealth amount associated with them. How does the ratio compare?
Did you receive 1% of the donor’s capacity, or 99%? Across your entire portfolio, and across the entire major gifts department, you should measure this metric.
Number of moves per month
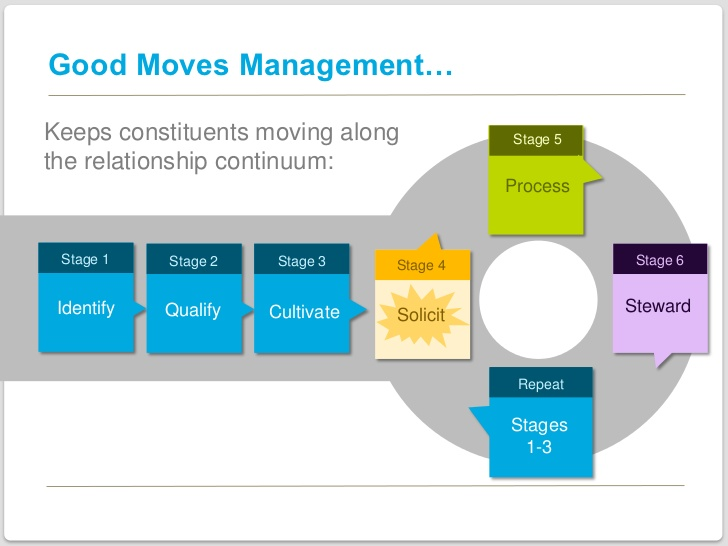
Ask any director of a major gifts department which metric they measure most closely and you shouldn’t be surprised to hear them say “moves per month.” As part of our ongoing investment in product development at my parent company, MarketSmart, I’ve spent countless hours on the phone with these very people, and when it comes to KPIs and performance metrics I always hear about “moves per month.”
“Moves” refers to “moves management,” the process nearly all major gifts departments employ to ensure prospects are being engaged and shepherded through their fundraising process. Moves per month is the measure of how many of these engagements a major gift officer is making within a four week period.
This KPI is important to measure on an individual gift officer basis, but also on a departmental basis. Be careful though, this metric can be easily inflated.
Although we are measuring the number of moves per month, it’s important to also acknowledge which moves are more significant than others. For example, if your department begins measuring moves per month, and you offer some sort of reward for increasing the numbers of moves per month from 30 to 32, please don’t be surprised if your staff simply performs the “easiest” move on two extra prospects to achieve their goal. Different moves carry different weight, and that can never be overlooked.
So, the caveat may be “significant” moves per month. Qualify with your team which moves are part of the “significant” category, and then measure the number of times those moves occur per month.
Applying this at your shop
There you have it, different development departments have different key fundraising metrics. That probably doesn’t come as too much of a surprise. But, in a world of “big data” and “metrics, metrics, metrics,” sometimes it can be refreshing to see a few examples of what you really need to focus on.
If you’re a small shop, you don’t need to worry about these more specific fundraising metrics, instead read articles like this one. But, if you’re at a larger organization, consider the four metrics presented above, and use tools like the Fundraising Report Card® to help you calculate those metrics quickly.

Have you read Penelope Burk’s book on annual giving? “Donor Centered Fundraising.” She quotes a national statistic on new donor retention.
Marianne, I haven’t. I’ll look into that now. Thanks for reading and commenting, always nice to hear from you 🙂