
Have you been to Macy’s recently? If you haven’t, you sure are missing out. No, there isn’t a giant sale going on (although, I’m sure there will be soon), instead there’s something better. Walk down the aisles and you’ll find yourself humming along to Mariah Carey’s All I Want For Christmas Is You.
Yes, the leaves are changing, the temperatures are falling, and the carols are blaring. It’s officially the end of the year.
We talk a lot about the end of the year here on the Fundraising Report Card® blog, and with good reason. Most organizations experience a substantial spike in giving during October, November and especially December. Plenty of websites provide suggestions for finishing your end of year strong, whether it be with the right language on your appeal letter, the perfect ask amount, or even segmenting your list to hyper target donors.

Today’s conversation will be a bit different. Instead of focusing on tactics to implement right now, we’re going to discuss how to measure your successes after the fact. Sure, there are a million things going on right now in your office (this is the busy season for a reason), but what about towards the end of January or February? Things should hopefully be a little less hectic then, and at that point you’ll want to know (need to know) how well the development department performed. How can we measure fundraising performance from last year, and in particular the end of the year, to help inform what we should be doing this year?
That’s the question we’ll aim to address.
Average donation amounts
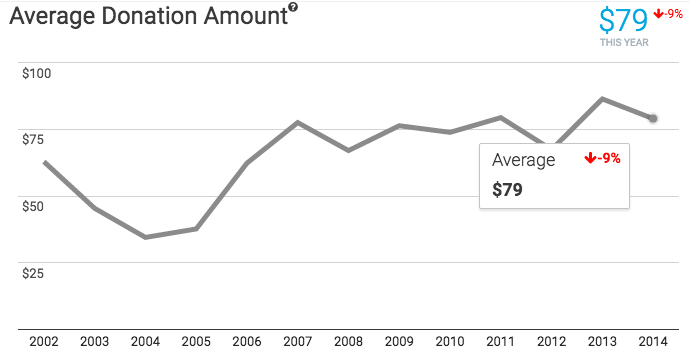
The first metric you’ll want to address is average donation amounts, and simply the question you’ll want to answer is, “did they go up or down?”
End of year fundraising tends to provide a large spike in the number of donors giving to an organization. That also tends to correlate with a decrease in total dollars raised. How can that be?
For most organizations, year end donors tend to give smaller donation amounts than other donors who give during the middle of the calendar year. Does your data show that same pattern? Have average donation amounts increased in the fourth quarter year over year, or have they decreased?
Having answers to these questions can help you better understand your year end spike in giving. Sure, the increase in donors is great (more people engaged with the organization), but if that isn’t paired with an increase in donations (the total dollars received by the organization), that needs to go into your “game plan” for next year. The realization might be that instead of allocating a lot of your resources towards end of year giving you instead partition some towards upgrading last years end of year donors.
Whatever the next step, having trends in average donation amounts by your side can help you justify a decision. Even more importantly, identifying and seeing trends in average donation amounts will help further the discussion internally, and that’s key when looking at metrics.
Lapsed donors
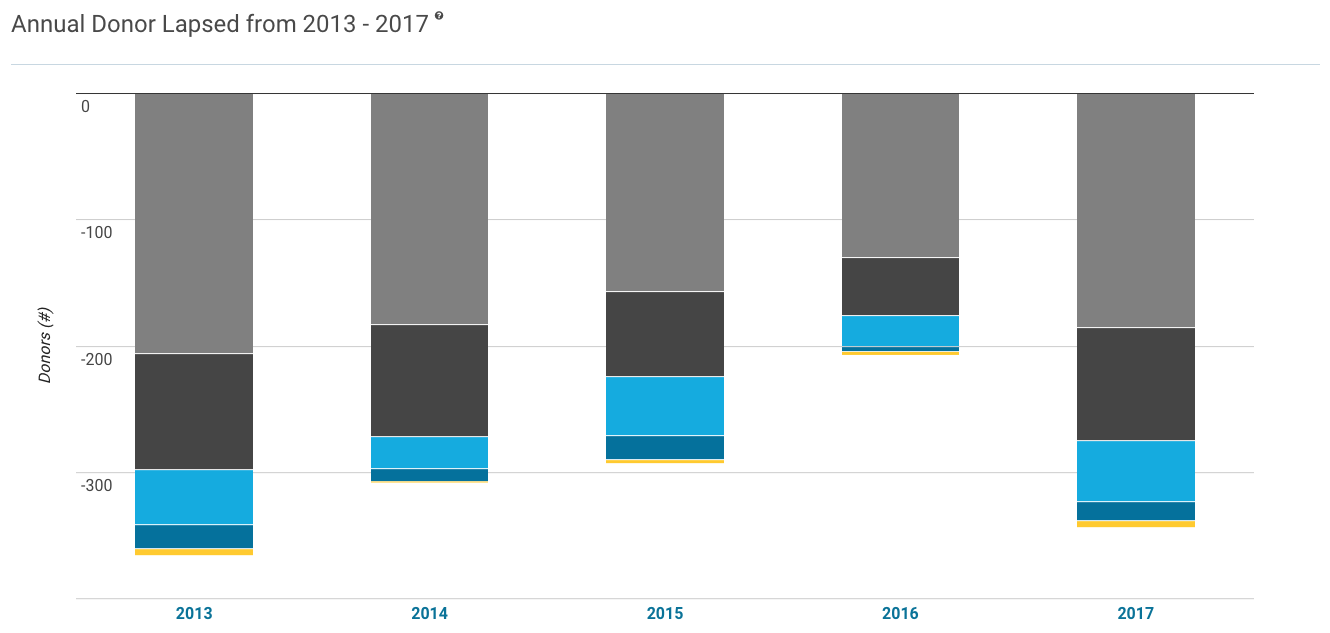
As a metric, lapsed donors is not one we are too interested in. Why is it on this list then? Because lapsed donors are more important than simply being a metric, they are people, real donors, a segment of individuals and funders we can engage with.
Which donors from last year (2016) didn’t renew in this year (2017)? Who are they, what are their stories? Lapsed donors as a metric will tell you how many donors didn’t renew this year versus last, and how many dollars that represents, but more importantly, identifying and knowing who your lapsed donors are can empower you to segment and target your future engagements.
Now that is powerful.
When you target the right person at the right time with the right message you are set up for success. Knowing who your end of year lapsed donors are means you can send segmented emails with specific language relevant to their giving history. Targeting this subset of individuals can increase reactivation rates (the percent of donors who lapsed and then came back), as well as help future retention rates.
Speaking of donor retention…
Retention rates
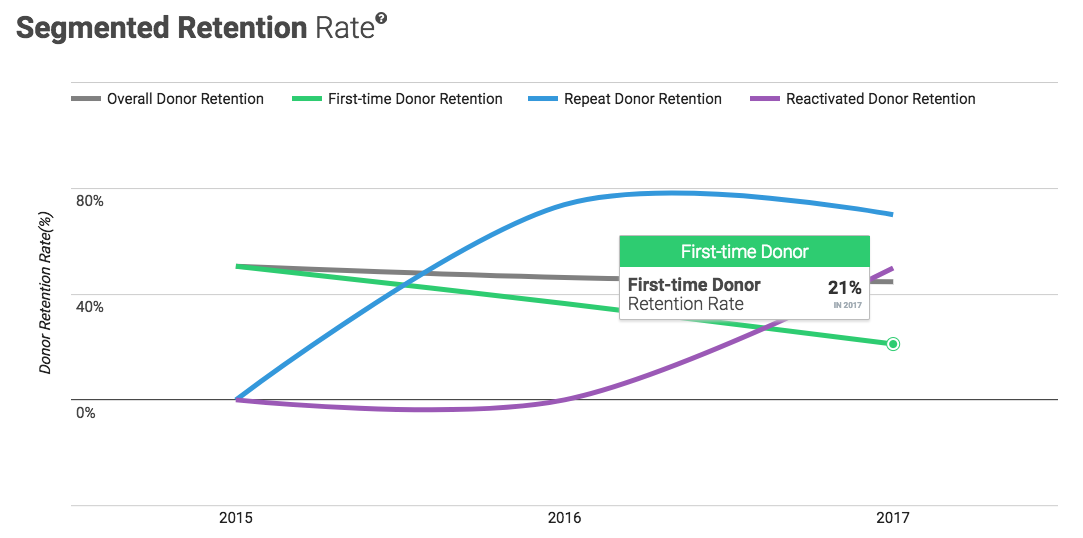
Similarly to lapsed donors, we’ll be interested to know who was retained year over year. When it comes to year end giving, a lot of donors like to “shop” their donation before aligning themselves entirely with one charity. What does that mean for your organization? Has there been an increase or decrease in the number of retained donors year over year? Just like with lapsed donors, can we go beyond the metric and actually identify who these retained donors are for specific engagements?
End of year donors are notorious for moving between a variety of organizations. Reviewing your end of year donor retention rates can help you determine if past initiatives and efforts to renew donors are working, or whether you need to take a different approach next year.
As a metric, retention rates are incredibly important, but in the context of year end donors, you’ll be even more interested in which donors actually make up the metric.
Applying this at your shop
Sure, we’ve covered a lot of information, and it very well may feel intimidating right now, but remember, you’ll want to act on these suggestions in a few months, not today. Today (and the following weeks) should be (or at least, most likely are) spent making sure your final appeals go out smoothly. These metrics and measurements will be most useful when you can sit down and discuss them with your team.
“Why do we think average donation amounts went down?” “What can we do to improve our donor retention rates?” Etc.
Bookmark this page, check back when things are bit less hectic, and remember, you can always get in touch with one of us here at Fundraising Report Card® to see how we can help you get the most out of your data.
Measuring and reporting development office success can be tricky, but this year it doesn’t have to be. Average donation amounts, lapsed donors and retention rates will help make sure end of year 2018 is a smashing success.