Is your fiscal year coming to a close? Do you have a board meeting soon and are unsure what to share?
After partnering with hundreds of directors of development, chief development officers, and development associates, our team here at Fundraising Report Card® has figured out exactly what information your board members are most interested in seeing when you are up “on stage.” Sharing a progress report with leadership doesn’t need to be intimidating. Presenting the right materials and the right metrics can make the entire process more pleasant and insightful for everyone involved.
Sharing metrics like total dollars raised, and total number of donors, can be helpful for board members who are new or who aren’t very engaged, but more sophisticated metrics, like donor retention rate and a few others can provide meaningful insight to leadership.
With only a few minutes to share your departments successes, it can be challenging to decide what to highlight and share with the board. With our helpful tips and tricks you can now inform your selection process.
Today we’ll walk through 3 metrics you’ll absolutely want to share with your board members at the next annual meeting. These metrics come from our team’s experience presenting to dozens of boards over the past few years. Of course every organization is different, and you know your board dynamics better than anyone else, but if you are looking for a place to start, use these 3 metrics to make sure everyone finds value in your presentation.
Let’s dive in.
3 year trends in donor retention rate
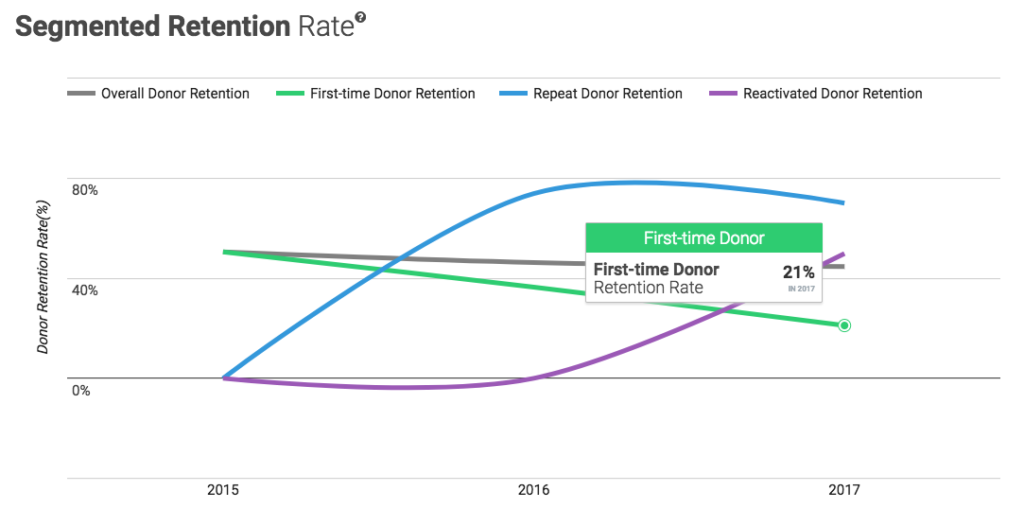
Donor retention rate is the buzzword of our industry, and with good reason. Donor retention rate measures the rate at which your development department is maintaining relationships with active donors. Most donor retention rates are calculated on an annual basis (how many donors did we retain this year from last year?).
“Did Jane Doe, who donated $50 last year give again this year?” If she did then she would be considered retained, if she didn’t she would be considered lapsed.
Donor retention rate is calculated by taking the count of all retained donors from this year and dividing them by the count of all donors from last year. You then multiply that number by 100 to get a percentage. It’s important to note that donor retention rate is capped at 100%. You can only retain 100% of all the donors that gave to your organization last year.
For example, if 100 supporters donated to your organization last year, and then 90 of them made another contribution this year, your organization’s donor retention rate would be 90%. 90 ÷ 100 = .9, and .9 * 100 = 90%.
Why do board members appreciate seeing 3 year trends in donor retention rates? It’s simple. A 3 year picture of retention rates allows the board to quickly grasp how sustainable the organization’s fundraising truly is. When retention rate is high, or simply trending higher, it is a sign that the organization is doing a good job developing relationships with it’s funders. When retention rates slip it is an indicator to the board that a change in strategy or tactics needs to be considered.
High retention rates are not the end all, but they do indicate consistent and (generally) sustainable fundraising. Low donor retention rates lead to inconsistencies in funding, and board members will appreciate you sharing this metric (for better or worse) with them.
Read more on donor retention rate here.
3 year trend in lapsed donors
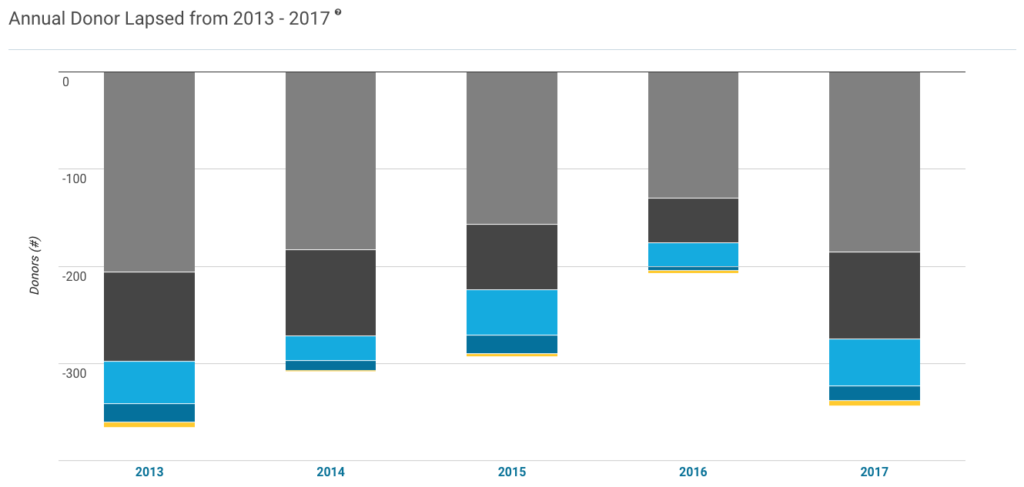
The opposite of retention is attrition. Donors who previously made a contribution to your organization (for our sake we’ll say last year), and then did not renew their contribution the next year (at any dollar amount) are considered lapsed donors.
Quantifying how many donors lapsed, and how many dollars were not renewed, can help justify allocating resources towards increasing donor retention. Board members appreciate seeing trends in donor attrition, because it represents a very real opportunity for growth and stability for the organization. Retaining a handful of lapsed donors could swing the bottom line tens of thousands of dollars, and for a board member to visualize and understand how that metric has been trending over time is important.
Some organizations do not calculate lapsed donors on a year-over-year basis, instead they focus their attention on 18 month lapsed donors. You know your constituency better than anyone else, that’s for you to decide.
Regardless, check your donor database, do they have a lapsed donor report? Can you query it for the past 3 years? If not, consider uploading your data to Fundraising Report Card® — the lapsed dashboard is part of the free account.
Donor lifetime value
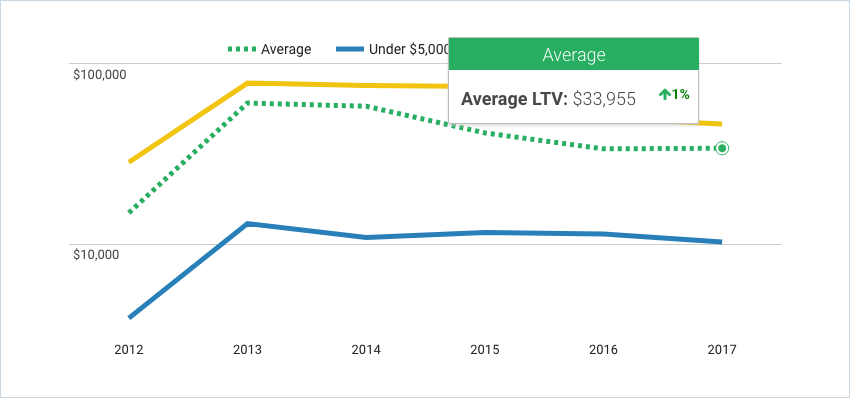
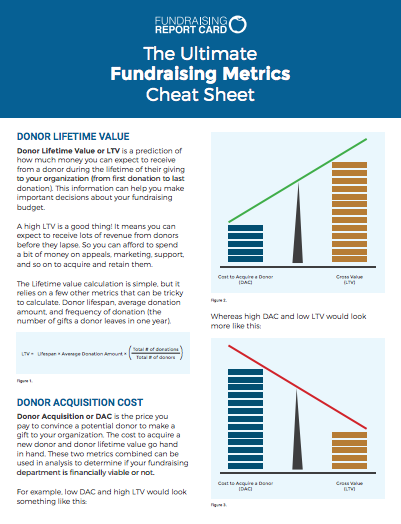
In an effort to further build the case for support to allocate resources towards donor retention, our team has found donor lifetime value to be a key metric worth sharing with board members. Donor Lifetime Value, or LTV, is a prediction of how much money you can expect to receive from a donor during the lifetime of their giving to your organization (from first donation to last donation, acquisition to lapse).
Because lifetime value creates a projection of what a relationship with a donor is worth, it can help leadership look beyond the immediate concerns of “we spent how much to raise that amount of money?” Lifetime value frames your conversation around lifetime giving, not transactional, one-time giving.
By shifting the conversation away from individual appeal performance, lifetime value can help justify and solidify an organization’s need to invest in donor retention strategies and tactics. For board members this can be (and we’ve seen it happen) an “aha!” moment.
Calculating LTV is relatively simple, but it relies on a few other metrics that can be tricky to calculate. To calculate your organizations LTV you’ll need to know your donor lifespan, average donation amount, and frequency of donation (the number of gifts a donor leaves in one year).
The formula ends up looking like this:
LTV = Lifespan × Average donation amount × Frequency of donation
This is another metric we prepare for you within the Fundraising Report Card®, but before you calculate it on your own, or use the FRC, consider reading this longer guide on Measuring Fundraising ROI with Donor Lifetime Value.
Applying this at your shop
Board meetings can be tricky. Knowing what information to share, how to display it, and why it is important are all key factors that shape the “success” of a presentation.
With a lot of responsibilities on your shoulders, our hope was to share a bit of the knowledge we’ve gained over the past few years when it comes to sharing development information with board members. Every once in a while leadership appreciates a “peek under the hood,” and the 3 metrics we mentioned today will give them exactly that.